迫在眉睫的金融大屠杀,多个市场出现巨大熊市形态
收藏() 评论() 字体: 大 / 中 / 小
迫在眉睫的金融大屠杀,多个市场出现巨大熊市形态 评论:一个金融大屠杀迫在眉睫,多个市场出现了巨大的令人毛骨悚然的熊市形态。黄金将跌至900美元的第一支撑,甚至跌至800美元的第二支撑。中国的上证终指将跌破2008年的低点,标准普尔也将大跌,铜、油、银、贵金属股票均出现双顶形态或头肩顶形态,预示大跌在即。防御策略:现金为王。但必须牢记:由于预期大萧条2-3年后将出现恶性通货膨胀,黄金将很快复苏并走出新高。 The Looming Financial Holocaust, Massive Bearish Patterns Across Multiple Markets 2010 May 30, 2010 - 05:23 PM By: Clive_Maund
We had expected the broad stockmarket and the resource sector to stabilize and start to recover last week and they did, and while we are likely to see further recovery in the days and perhaps weeks ahead, there have been some ominous developments in the recent past that we would be most unwise to ignore. The market did not go into full crash mode because it was not technically ready to, although it got close to it, and crucial support held - for now. However, heavy technical damage was inflicted and a broad review of long-term charts reveals that a blood-curdlingly dangerous setup has developed across a wide spectrum of markets.
You may recall that day early in May when the Dow Jones Industrials mysteriously plunged by nearly 1000 points intraday. In an effort to placate unnerved investors, the media tried to pass it off as a technical glitch. What actually caused it was a wave of heavy selling caused by those who suddenly �saw the writing on the wall�. If this drop was due to some technical glitch then why, after bouncing, did the market drop to even lower levels a week or two later?
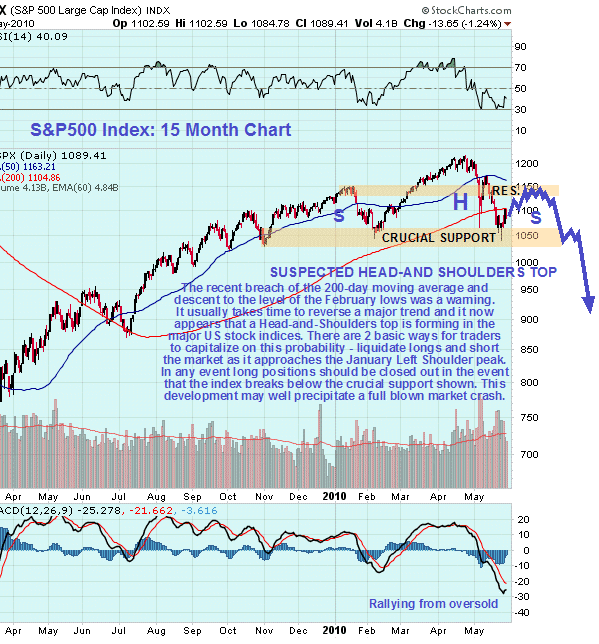
On our 15-month chart for the S&P500 index we can see why last month�s sharp drop inflicted such heavy technical damage. One reason is that it broke the market below its rising 200-day moving average, the first time that it has been below it for 10 months, which is the harbinger of a major trend change. Another reason is that it took the market down to its February low, which is the first time we haven�t seen a higher low.
The crucial support at the February low held, but bulls should draw little comfort from this as the way that the market dropped back sharply to these lows and has then bounced suggests that it is marking out a Head-and-Shoulders top, and if it is then the current rally can be expected to peter out at or below the January high, which is the Left Shoulder of the pattern. From a practical standpoint what this means is that investors in the broad stockmarket are being presented with one last chance to get out before the index breaks down from this pattern, which would be expected to lead to a rapid and severe decline. There is an argument that as we approach hyperinflation there will be more money flying around to drive up the price of everything and that, therefore, the stockmarket could rally in points terms, or nominally, even as its real value is falling.
What this ignores is that while the ordinary Joe may be paid twice as much as the year before, if the money only buys say 20% of what it bought the year before, his purchasing power is still greatly reduced. When people stop buying, companies stop selling and earnings collapse. The recent dramatic earnings recovery was the result of massive injections of newly created money and stringent cost cutting, and it was discounted by the market some time ago now, which is why we had the strong rally from March of last year. Whilst we acknowledge that these Head-and-Shoulders top patterns sometimes abort, it looks highly unlikely that this one will, especially as this pattern is confirmed by similar bearish patterns in other markets as we will shortly see.
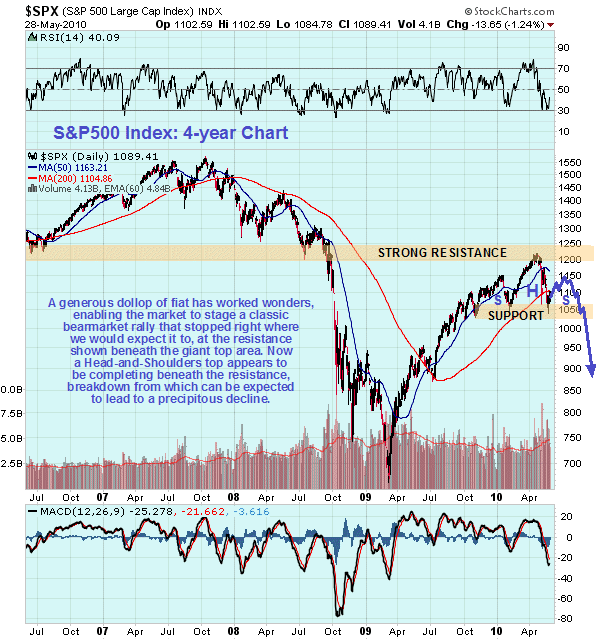
The 4-year chart for the S&P500 index is interesting as it reveals why the index topped out where it did in April - it had arrived at strong resistance approaching the giant 2000 - 2007 Double Top. This chart also makes it abundantly clear that this so-called bullmarket was nothing more than a sizeable bearmarket rally.
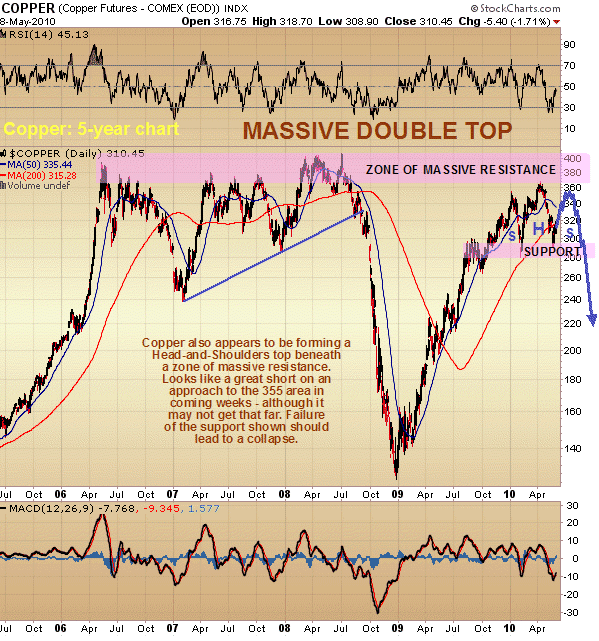
Copper has such a good record of front running major market moves that it has earned the nickname �Dr Copper� as it is frequently a good gauge of the future health of the market. So it is interesting and appropriate for us to take a look at the copper chart now. The 5-year chart for copper presents a bleak and ominous picture, for a massive Double Top appears to be completing with the price topping out beneath the zone of massive resistance approaching the 2006 - 2008 highs. Just as with the S&P500 index copper has dropped down to the neckline of a Head-and-Shoulders top area, and now appears set to mark out a Right Shoulder before finally breaking down and plunging. This hardly augers well for the world economy.
